Equity Insights
In a nutshell
- Equity leadership remains highly concentrated in US growth and AI-related names, yet elevated volatility, higher-for-longer rates and record global dividends argue for a broader architecture of equity return drivers
- Since 2000, more than half of cumulative equity gains in many markets have come from reinvested dividends, with compounding creating a persistent gap between price-only and total return indices
- Dividend streams have typically exhibited less volatility than earnings, making them a relative anchor for total returns when earnings are cyclically pressured, provided cash flow resilience and balance sheet strength underpin payout policies.
- As a systematic factor, too, dividend yield has delivered positive long-short alpha across all major macro regimes since 2005, with particular strength in recoveries and in periods of elevated inflation and interest rates, while remaining only moderately correlated with traditional valuation exposures
- The global income opportunity set is structurally diverse, spanning Europe’s established dividend culture, Asia’s improving capital return frameworks, higher yielding Latin America and selected US growth franchises that now combine durable cash generation with disciplined distributions
- Given the characteristics, high quality dividend payers can be paired with long duration growth and AI beneficiaries to improve portfolio resilience, reduce single theme concentration risk and deliberately reintroduce income as a distinct return driver
Broadening out into dividends
The equity cycle of the past decade has been defined by US growth, particularly technology, leaving dividends somewhat overlooked.
From 2015 onwards, investors have been fixated on earnings growth and multiple expansion in a narrow set of leaders, even as income continued to make a substantial contribution to total returns in the background. That contribution is now becoming harder to ignore.
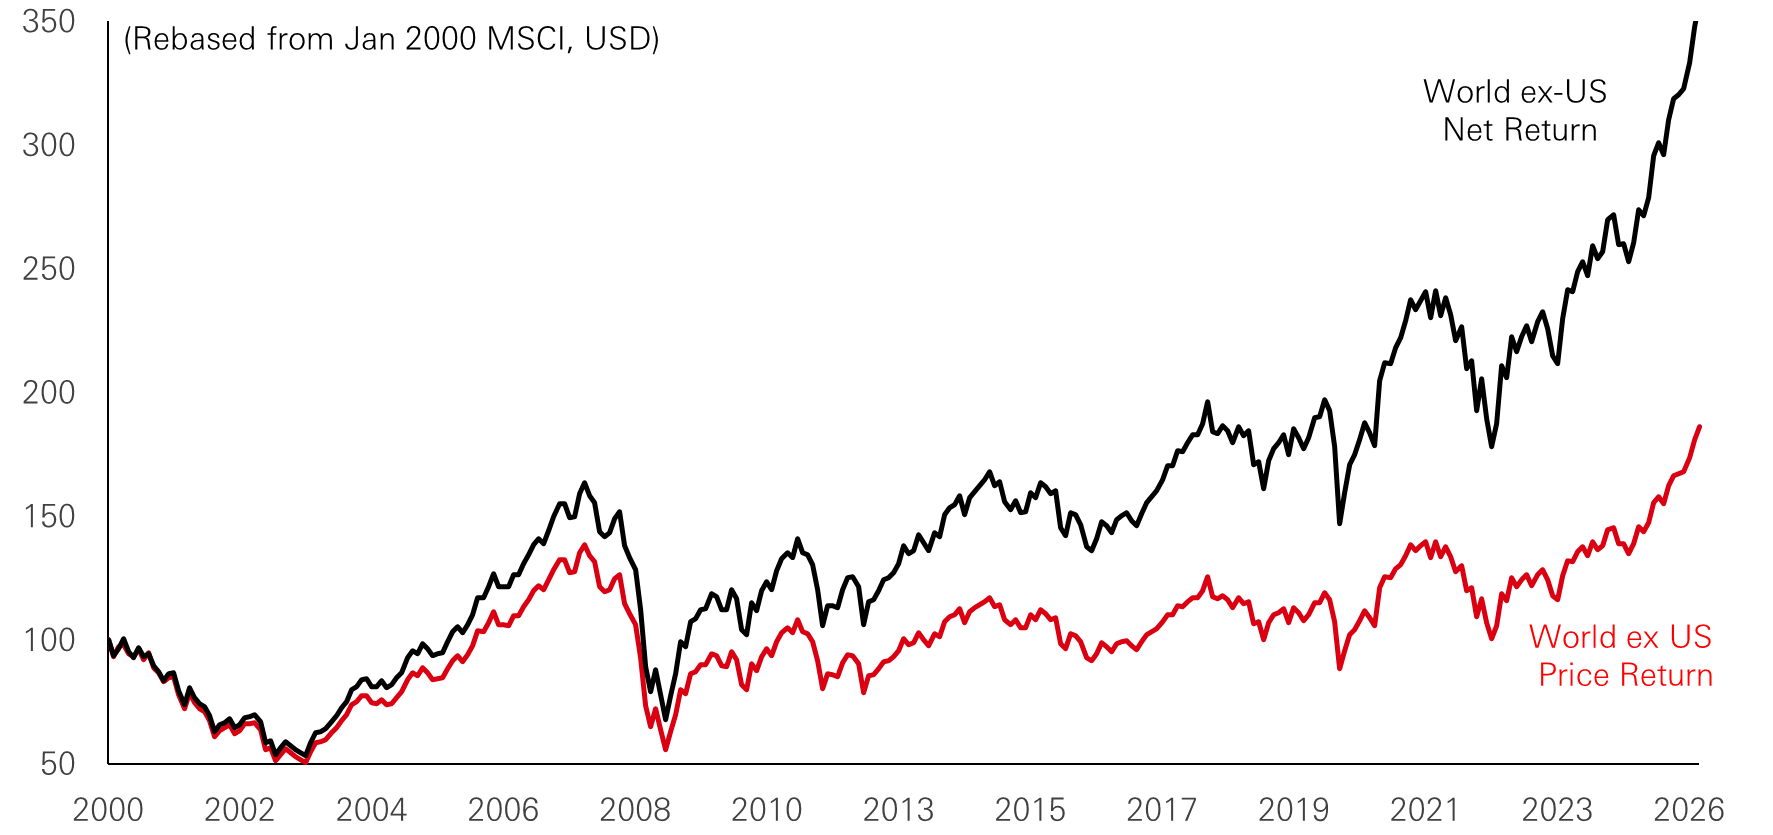
At the same time, the contribution of dividends to total return is often underappreciated. Looking at post-2000 returns, more than half of the cumulative gains in many equity markets have come from dividends, once reinvestment and withholding taxes are taken into account. The gap between price-only indices and net total return indices is striking, underlining how powerful the compound effect of reinvested income can be over long horizons.
Figure 1: MSCI World ex. US price index versus net return
Click the image to enlarge
Past performance does not predict future returns.
Source: HSBC AM, Refinitiv, Datastream, MSCI. Data as of March 2026.
The relevance of dividends is not merely historical. Global dividends reached a record USD 2.1 trillion in 2025, up 7 per cent year-on-year, with Japan leading growth at 13 per cent, followed by Europe and emerging markets. Importantly, this was not a story driven by one or two sectors. The growth was broad-based across regions and industries, suggesting that the income opportunity is not scarce; rather, it has been obscured by the dominance of growth narratives.
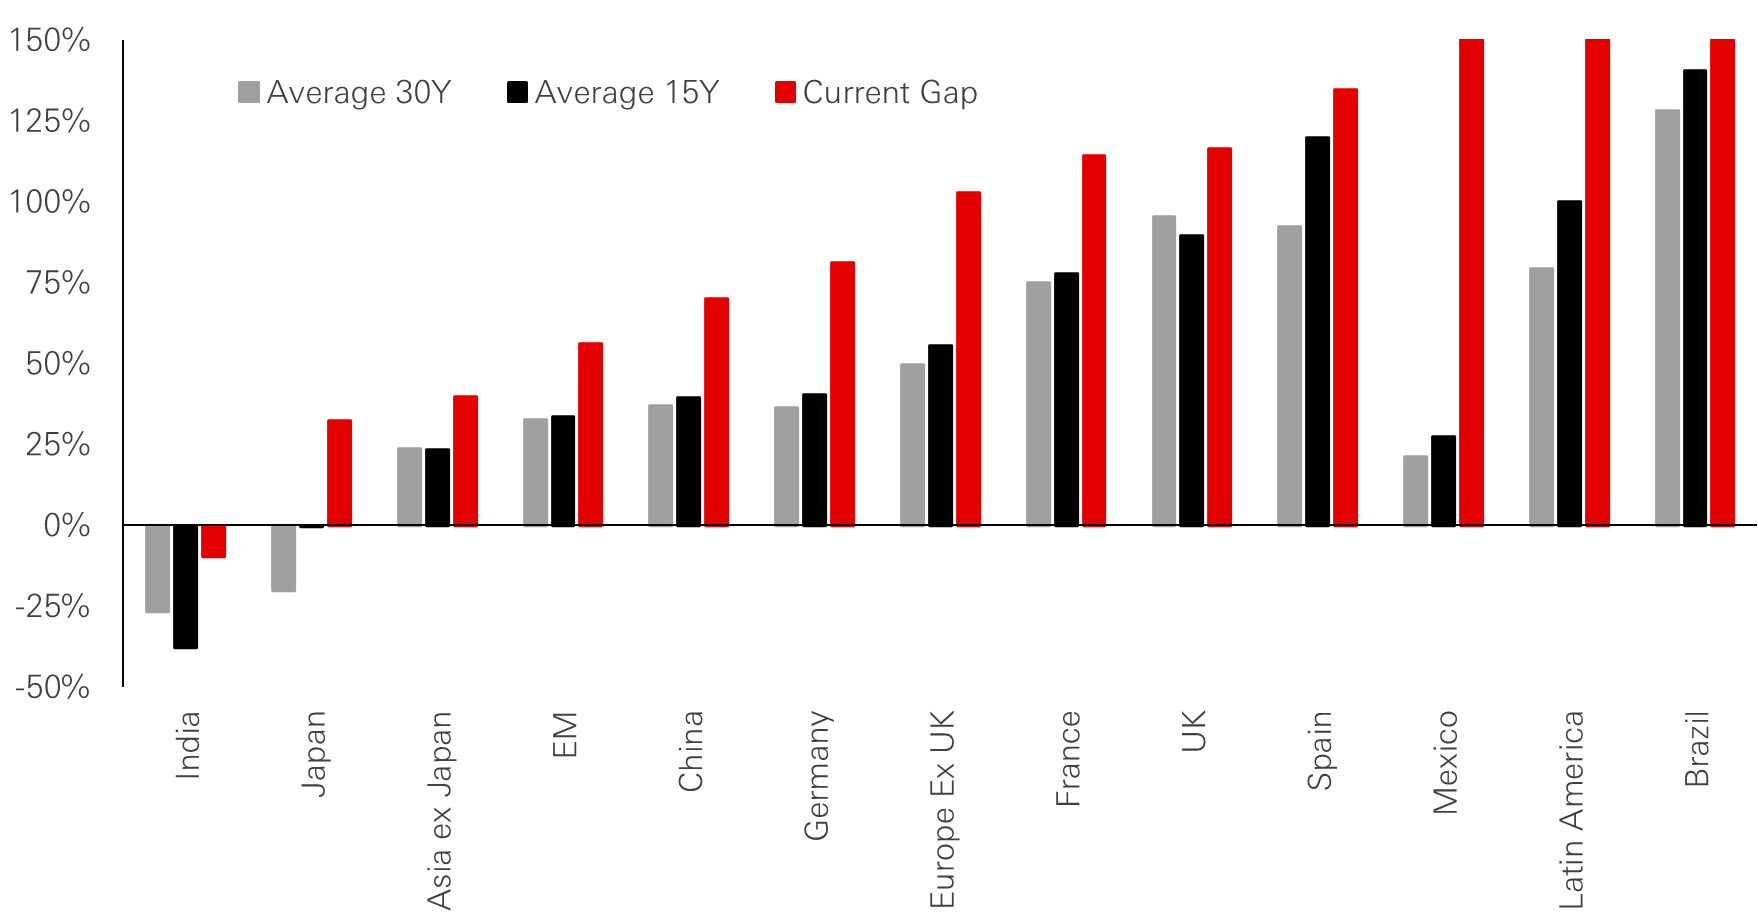
Yield differentials reinforce the diversification theme. The US equity market currently yields around 1.5 per cent, whereas the UK yields just over 3 per cent, and parts of Latin America, including Brazil, offer yields above 4 per cent. Japan, historically a low-yield market, has also seen a notable improvement in payout behaviour, narrowing the gap with the US.
Figure 2: Regional dividend yield gap versus US across different periods (per cent)
Click the image to enlarge
Past performance does not predict future returns.
Source: HSBC AM, Refinitiv, Datastream, MSCI. Data as of March 2026.
Higher sector yields outside the US and a volatile macro regime make income a natural extension of equity exposure.
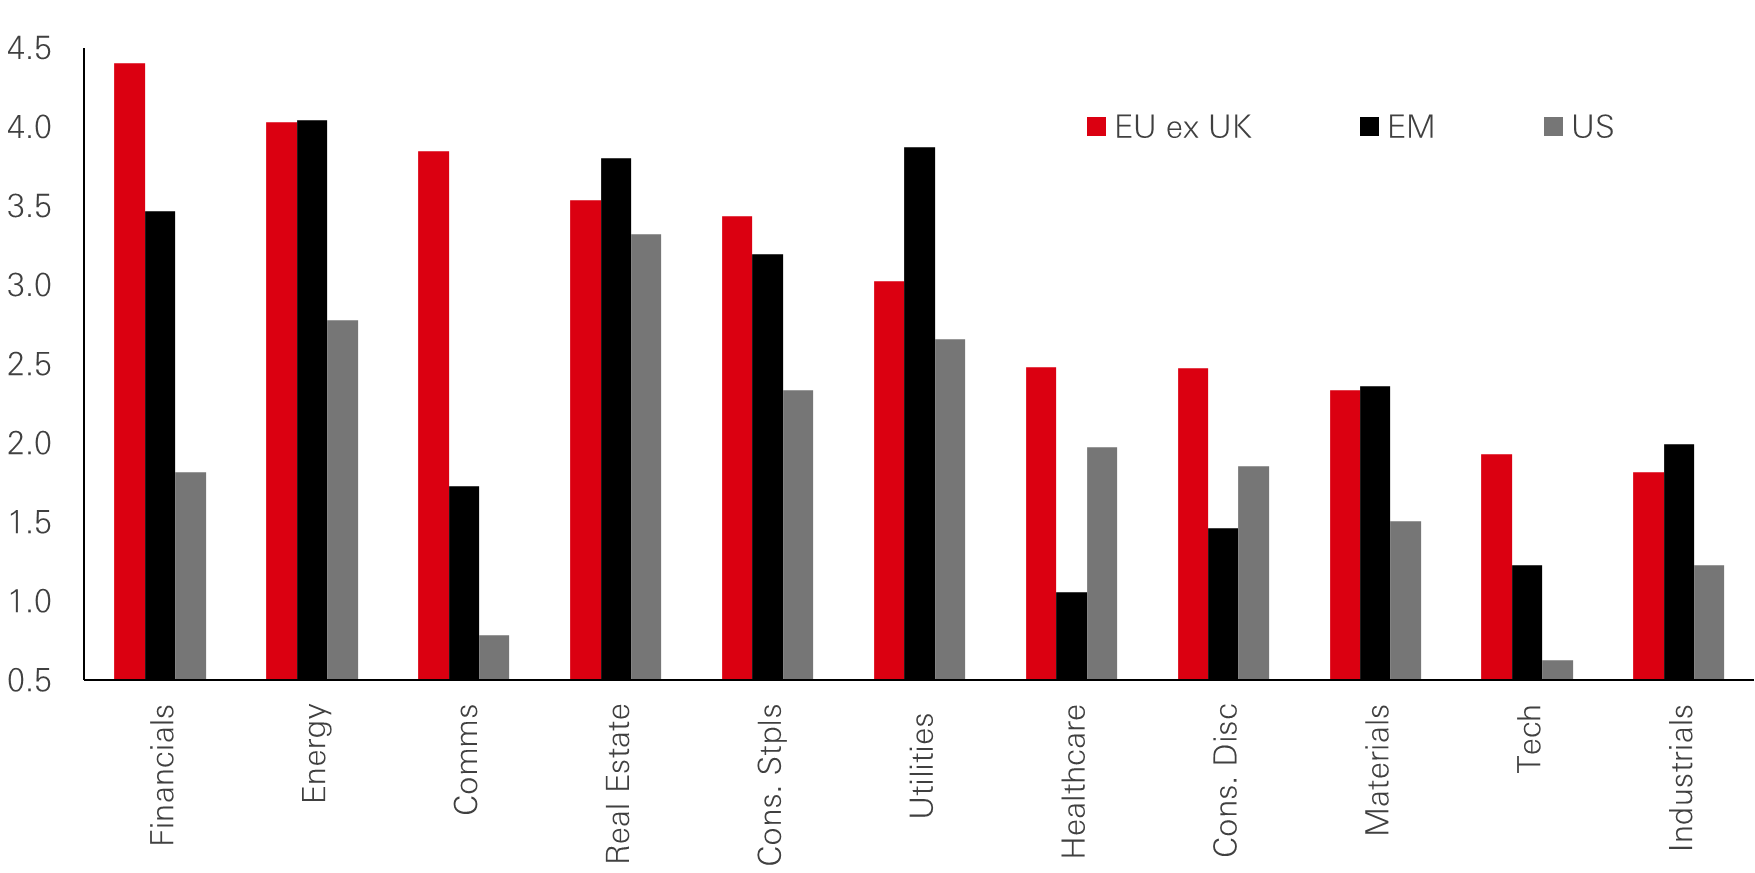
Sector-level comparisons show a similar pattern. Europe offers superior yields in energy, financials and telecoms compared with the US, while emerging markets provide attractive yields across both cyclical and defensive segments. By contrast, US technology, communication services and financials generally deliver lower cash yields, reflecting their growth orientation and capital allocation choices.
Figure 3: Sector dividend yield across regions (per cent)
Click the image to enlarge
Past performance does not predict future returns.
Source: HSBC AM, Refinitiv, Datastream, MSCI. Data as of March 2026.
That leaves investors with a more interesting backdrop than the one that prevailed through much of the last decade. Growth leadership remains important, but it is no longer the only framework through which equity exposure must be expressed. Record dividend levels, more attractive yields outside the US and a more volatile macro regime together make income investing look like a natural extension of the broadening out theme.
Dividends versus earnings: a relative anchor
Part of the appeal of dividends lies in their relative stability compared with earnings. Management teams are typically reluctant to cut dividends because doing so is often interpreted as a negative signal and can trigger outsized share price reactions. In practice, companies will usually reduce buybacks or other discretionary uses of cash before touching the dividend. That is one reason dividends often provide a steadier anchor for total return than earnings alone.
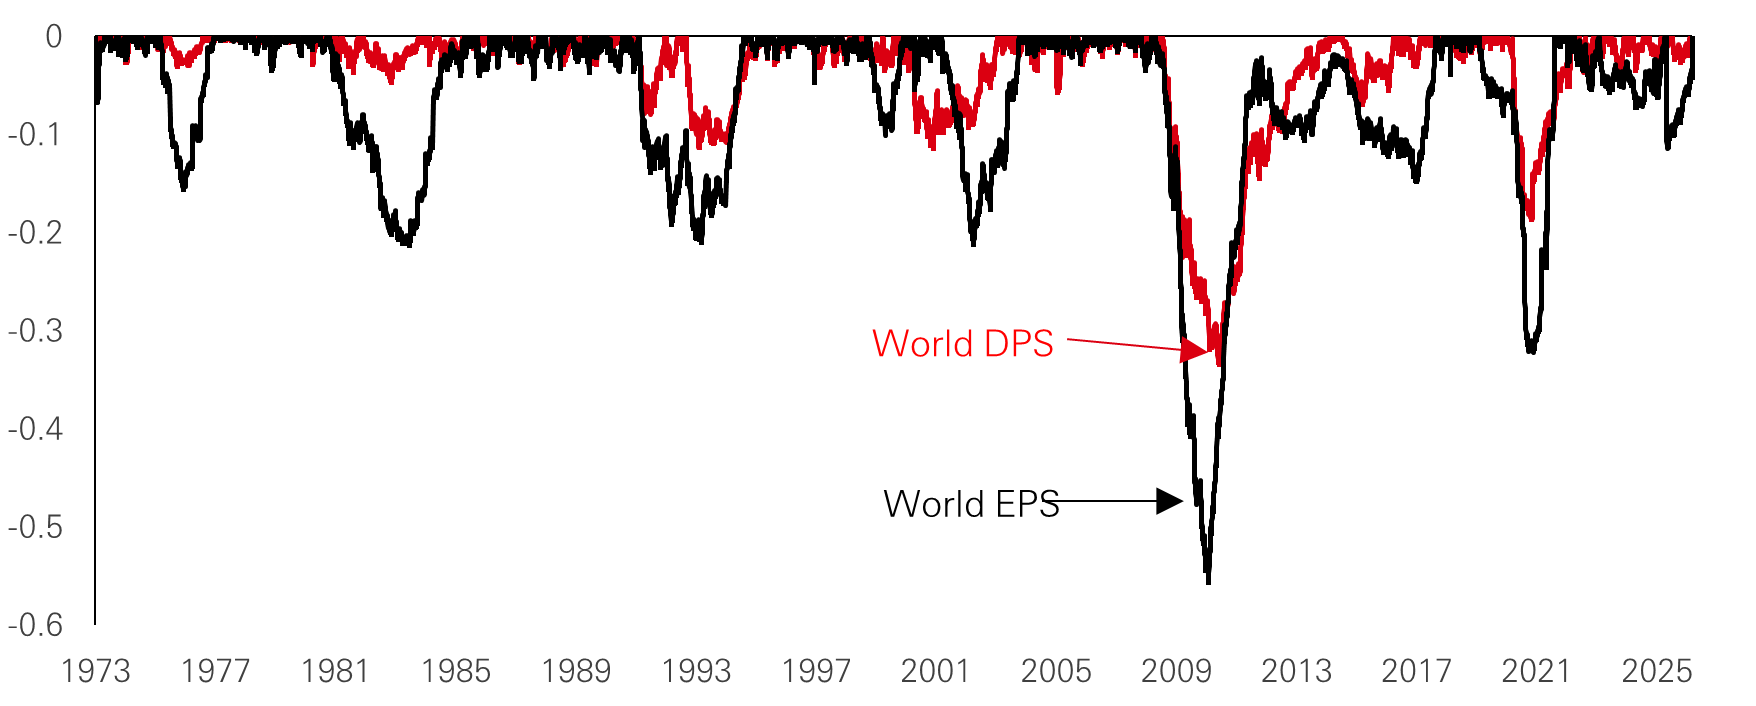
Over the past 20 years, dividends have generally exhibited far smaller peak-to-trough drawdowns than earnings – often only one-third to one-quarter of the magnitude seen in EPS at index level. The pattern is not universal, and there are clear exceptions, particularly in highly cyclical sectors or crisis periods – European banks during the global financial crisis are the obvious example – but the broader tendency remains clear that dividends are less exposed to the economic cycle than earnings.
Dividends typically fall far less than earnings, so sustainable payouts can anchor total returns through cycles.
Figure 4: Trailing World EPS and DPS fall from recent 5-year peak (per cent)
Click the image to enlarge
Past performance does not predict future returns.
Source: HSBC AM, Refinitiv, Datastream, MSCI. Data as of March 2026.
Sector evidence helps explain why. Energy dividends were temporarily hit during the pandemic, but many integrated majors have since repaired balance sheets, lowered capex intensity and now appear better placed to sustain payouts than in earlier cycles. Real estate investment trusts, often bought primarily for income, have historically delivered relatively stable distributions, though they remain exposed to financing and property cycles. Consumer discretionary, by contrast, showed that apparent resilience can be deceptive and parts of the sector saw substantial dividend cuts during the pandemic, despite strong brands and historically solid margins.
This is where income investing diverges from simple yield-chasing. A high payout ratio or an elevated dividend yield is not, in itself, a sign of quality. What matters more is the visibility of cash flow, the strength of the balance sheet and the discipline with which capital is allocated. Companies with robust free cash flow and prudent reinvestment frameworks are better positioned not only to sustain dividends, but to grow them over time. That distinction is crucial, because the strongest income opportunities are often found not in the highest-yielding names, but in businesses where distributions are one component of a broader capital allocation discipline.
In other words, dividends matter not simply because they are paid, but because of what their durability often implies about the business behind them. That is also why dividend yield becomes more interesting when viewed not only stock by stock, but as a broader factor in portfolios.
Dividend yield as a factor
From a quantitative perspective, dividend yield has been a surprisingly resilient source of excess return and a useful diversifier within equity portfolios.
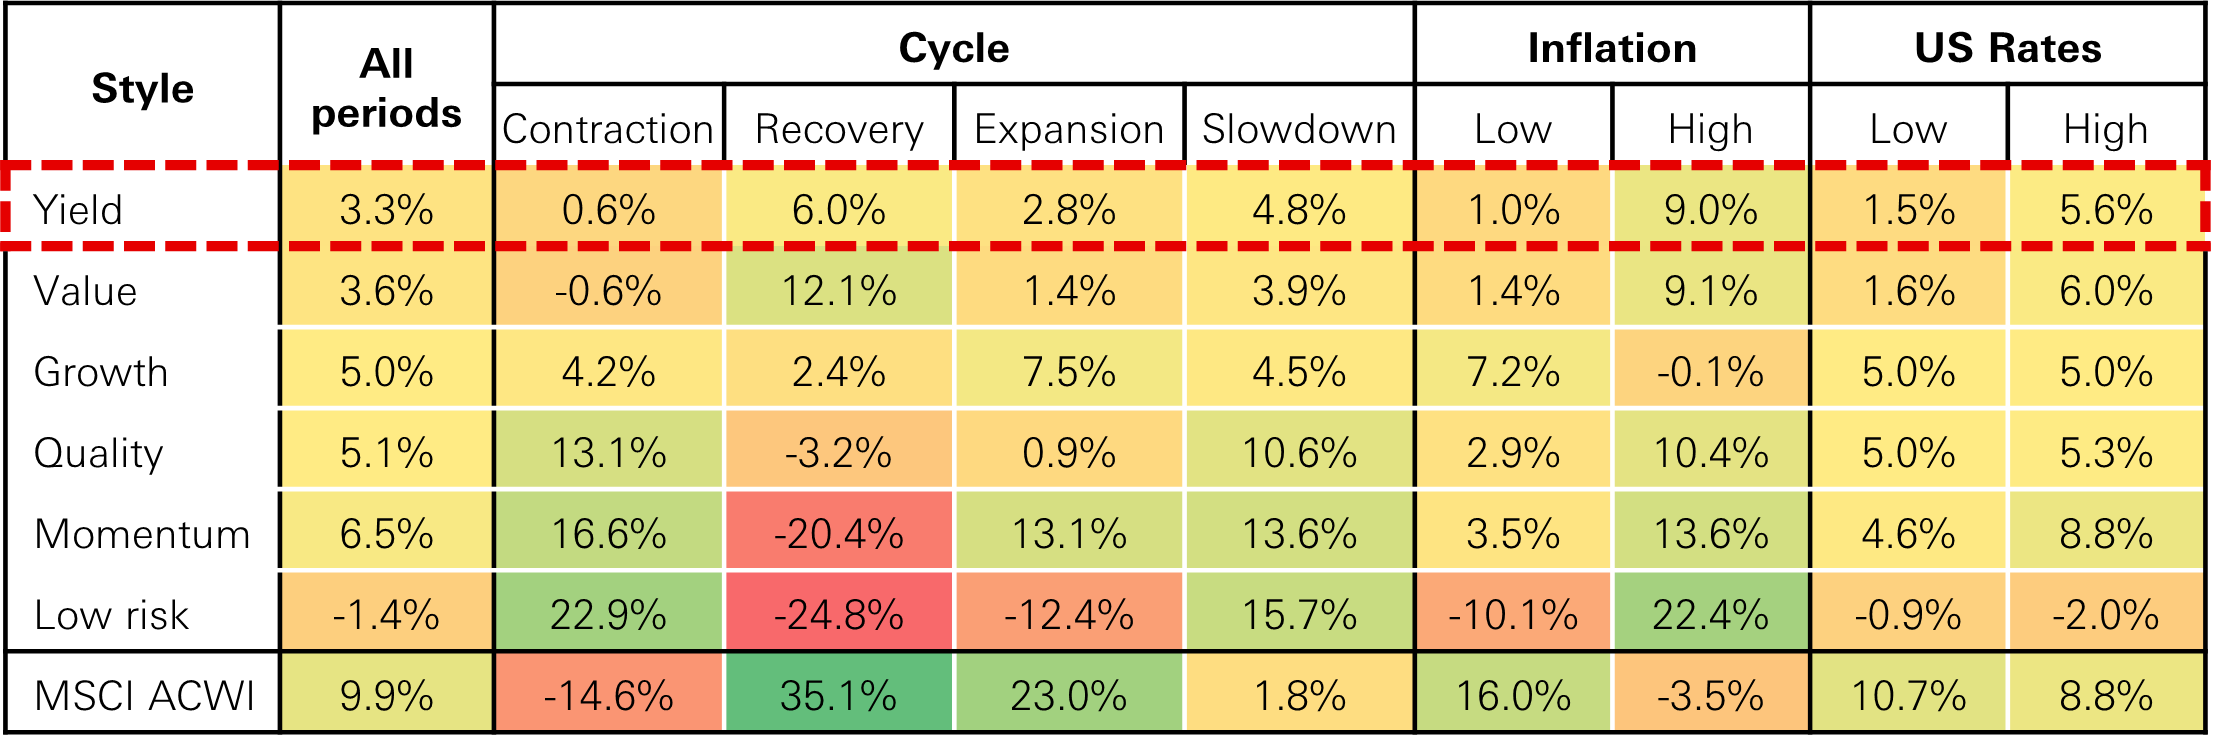
Using a simple long-short construction on MSCI AC World since 2005 – long the highest-yield quintile and short the lowest, equally weighted – the yield factor has delivered annualised alpha of just over 3%. While that is somewhat lower than the headline outperformance of factors such as momentum, quality or growth, what stands out is its consistency. Yield is the only major factor that has produced positive average returns across all key macro environments.
Dividend yield as a factor has delivered steady excess returns across cycles, distinct from traditional value exposures.
Figure 5: Annual medium-term EPS growth expectations (per cent)
Click the image to enlarge
Source: HSBC Asset Management, Bloomberg. Data from Jan 2005 - Jan 2026 on MSCI ACWI universe. Style returns are long-short alpha factor constructions, equally weighted of top and bottom quintile of stocks in their category. OECD Global Composite Leading indicator used to define cycles - values<100 and decreasing =‘contraction’, value<100 and increasing='recovery', value>100 and increasing= ‘expansion', value>100 and decreasing='slowdown’. Inflation environments defined as – US CPI YoY <3% =‘low’, US CPI YoY >3% = ‘high’. Rate environments defined as – US 10Y yield <3% =‘low, US 10Y yield >3% = ‘high’.
Across the economic cycle, dividend yield has tended to perform best during recoveries, when growth expectations rebound and investors rerate companies whose earnings and cash flows had been overly discounted in the preceding downturn. In expansions, steady cash-generative businesses can still participate in the upside while offering an income cushion. In slowdowns, investors tend to place a higher premium on visible cash flows and established payout policies.
The weakest phase is usually outright contraction, when risk aversion spikes and markets prioritise liquidity and perceived balance sheet safety. Even then, yield has on average still generated slightly positive alpha, which is notable given that many traditional value exposures have historically suffered much deeper drawdowns. That is why yield should not be treated as another version of value; its income component can cushion returns and high yielding businesses often sit in more mature, less volatile industries.
The same logic appears in inflation and rate regimes. Dividend yield has historically performed best when inflation and rates are high, when markets become less willing to pay for distant cash flows and more focused on visible near-term income. In 2022, when inflation in the US peaked near 9%, the yield factor delivered excess returns above 13%, materially outperforming many other styles. High yield equities tend to behave more like short duration assets in such environments, because a larger share of their return comes from dividends in the near term rather than from cash flows far into the future.
Yield performs best in high inflation and rate regimes and offers low correlation to most major equity factors.
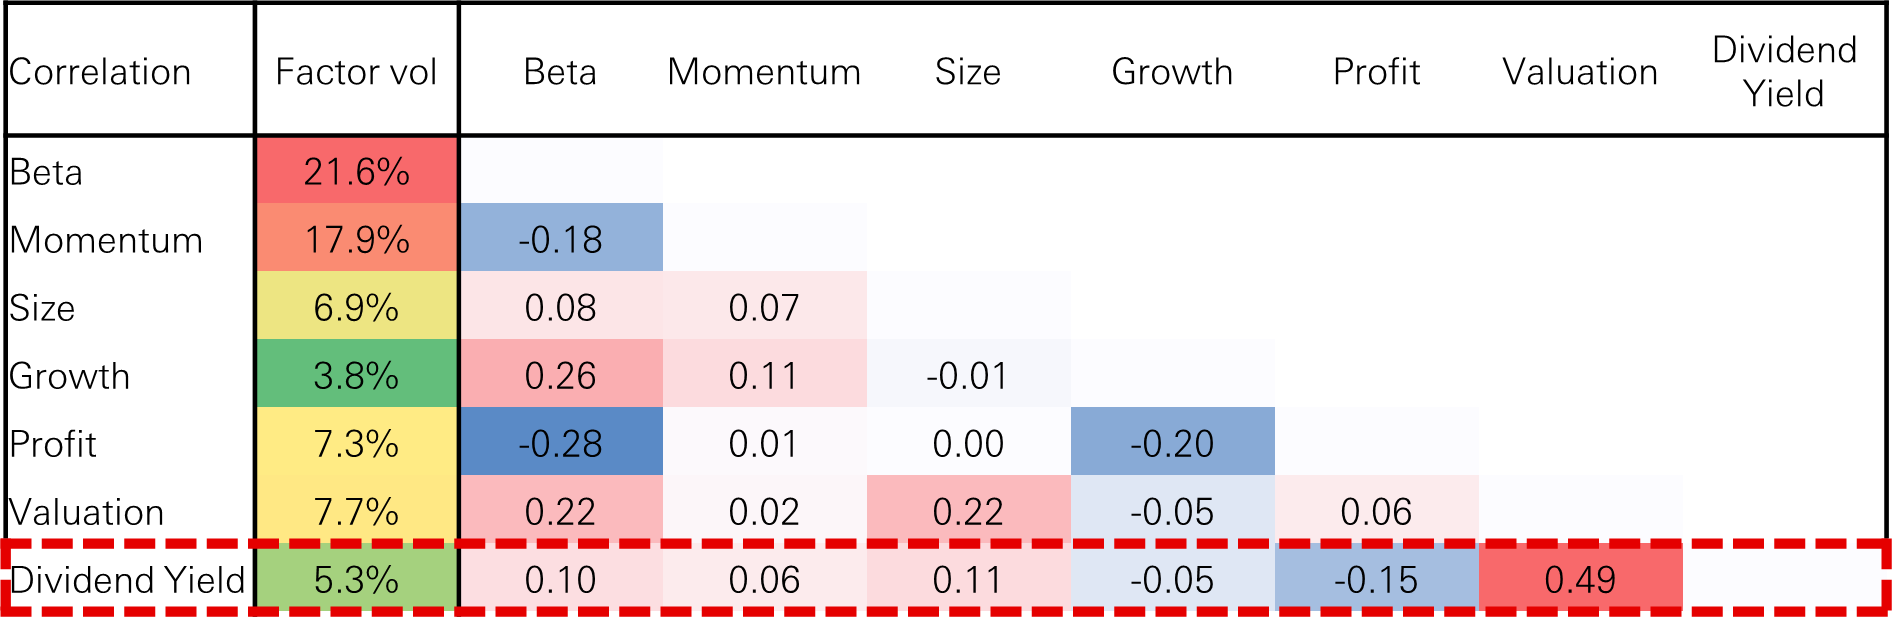
Its diversification properties also deserve attention. Dividend yield is largely uncorrelated with beta, momentum, size and growth, and only moderately correlated with valuation factors. That makes it useful not only as a source of return, but also as a way of smoothing broader factor risk. In an environment where leadership is widening and macro volatility is more frequent, that combination of defensiveness and diversification becomes more valuable.
Figure 6: Factor volatility and correlations
Click the image to enlarge
Past performance does not predict future returns.
Source: HSBC AM, Bloomberg PORT MAC3. Data as of March 2026.
Regional perspectives on income investing
Europe has long had a more established dividend culture than the US, with many companies explicitly managing payouts as a core element of shareholder returns. Compared with the US, headline dividend yields are structurally higher across much of the region, reflecting both more mature corporate life cycles and a greater emphasis on cash distributions. That profile is reinforced by sector composition, with large weights in financials, energy, utilities and telecoms – sectors that typically offer higher cash yields than the growth-oriented technology and communication services sectors that dominate US indices.
But Europe’s income case is not limited to traditional defensives. The region also contains globally competitive consumer, industrial and healthcare businesses with strong free cash flow generation, allowing investors to capture not just yield but dividend growth over time.
Asia, meanwhile, is often still viewed primarily as a growth region, yet dividends have historically accounted for more than half of total equity returns in many Asian markets. That contribution remains under-recognised because investor attention is often drawn to capital appreciation and headline growth narratives. In practice, however, corporate balance sheets in Asia are generally strong, with aggregate cash levels exceeding those of many developed market peers and creating significant room for dividends and buybacks.
Governance reform is helping unlock that potential. Japan’s corporate governance and ‘value-up’ initiatives, Korea’s attempts to address valuation discounts, and encouragement for higher payouts among Chinese state-owned enterprises all point to a gradual but meaningful shift in capital return behaviour.
While the US still offers lower headline dividend yields – reflecting its heavier tilt towards growth sectors – the income opportunity set is broader than is often assumed. A growing cohort of companies, including in parts of technology, now combine structural growth with disciplined capital return frameworks. The global income opportunity set is therefore not a simple choice between yield and growth, it is increasingly about identifying where strong cash generation, disciplined capital allocation and dividend growth intersect. These can often be found in growth companies.
Income strategy as a complementary approach
Taken together, the current market backdrop combines elevated concentration in a narrow set of US growth and AI-linked leaders, record global dividends, attractive yield premia in non-US markets, and a macro regime characterised by higher rates, episodic shocks and greater dispersion across sectors and regions.
That combination lends itself naturally to a more balanced approach. Rather than treating income and growth as competing styles, the more effective framework is to see them as complementary. On one side sit companies that ‘print cash now’ i.e. high quality dividend payers and growers selected for sustainable yields, strong balance sheets, high ROIC and prudent capital allocation across sectors such as financials, energy, utilities, telecoms and selected technology. On the other sit businesses with compelling long term growth prospects – including AI infrastructure and application leaders – that also demonstrate improving income characteristics or credible paths to future distributions.
This approach offers combined exposures to innovation and broadening market leadership without becoming overly dependent on a single theme, geography or valuation regime. It also restores something that has been easy to overlook during the long dominance of growth, which is the contribution of dividends to total return, and the role that cashflow resilience can play in improving portfolio balance.
For informational purposes only and should not be construed as a recommendation to invest in the specific country, product, strategy, sector or security. The views expressed above were held at the time of preparation and are subject to change without notice. Any forecast, projection or target where provided is indicative only and not guaranteed in any way. HSBC Asset Management accepts no liability for any failure to meet such forecast, projection or target. Index returns assume reinvestment of all distributions and do not reflect fees or expenses. You cannot invest directly in an index.
Past performance does not predict future returns. The level of yield is not guaranteed and may rise or fall in the future. For informational purposes only and should not be construed as a recommendation to invest in the specific country, product, strategy, sector or security. The views expressed above were held at the time of preparation and are subject to change without notice. Any forecast, projection or target where provided is indicative only and not guaranteed in any way. HSBC Asset Management accepts no liability for any failure to meet such forecast, projection or target.
For informational purposes only and should not be construed as a recommendation to invest in the specific country, product, strategy, sector or security. The views expressed above were held at the time of preparation and are subject to change without notice. Any forecast, projection or target where provided is indicative only and not guaranteed in any way. HSBC Asset Management accepts no liability for any failure to meet such forecast, projection or target.
Important information
For Professional Clients and intermediaries within countries and territories set out below; and for Institutional Investors and Financial Advisors in the US. This document should not be distributed to or relied upon by Retail clients/investors.
The value of investments and the income from them can go down as well as up and investors may not get back the amount originally invested. The performance figures contained in this document relate to past performance, which should not be seen as an indication of future returns. Future returns will depend, inter alia, on market conditions, investment manager’s skill, risk level and fees. Where overseas investments are held the rate of currency exchange may cause the value of such investments to go down as well as up. Investments in emerging markets are by their nature higher risk and potentially more volatile than those inherent in some established markets. Economies in emerging markets generally are heavily dependent upon international trade and, accordingly, have been and may continue to be affected adversely by trade barriers, exchange controls, managed adjustments in relative currency values and other protectionist measures imposed or negotiated by the countries and territories with which they trade. These economies also have been and may continue to be affected adversely by economic conditions in the countries and territories in which they trade.
The contents of this document may not be reproduced or further distributed to any person or entity, whether in whole or in part, for any purpose. All non-authorised reproduction or use of this document will be the responsibility of the user and may lead to legal proceedings. The material contained in this document is for general information purposes only and does not constitute advice or a recommendation to buy or sell investments. Some of the statements contained in this document may be considered forward looking statements which provide current expectations or forecasts of future events. Such forward looking statements are not guarantees of future performance or events and involve risks and uncertainties. Actual results may differ materially from those described in such forward-looking statements as a result of various factors. We do not undertake any obligation to update the forward-looking statements contained herein, or to update the reasons why actual results could differ from those projected in the forward-looking statements. This document has no contractual value and is not by any means intended as a solicitation, nor a recommendation for the purchase or sale of any financial instrument in any jurisdiction in which such an offer is not lawful. The views and opinions expressed herein are those of HSBC Asset Management at the time of preparation and are subject to change at any time. These views may not necessarily indicate current portfolios' composition. Individual portfolios managed by HSBC Asset Management primarily reflect individual clients' objectives, risk preferences, time horizon, and market liquidity. Foreign and emerging markets: investments in foreign markets involve risks such as currency rate fluctuations, potential differences in accounting and taxation policies, as well as possible political, economic, and market risks. These risks are heightened for investments in emerging markets which are also subject to greater illiquidity and volatility than developed foreign markets. This commentary is for information purposes only. It is a marketing communication and does not constitute investment advice or a recommendation to any reader of this content to buy or sell investments nor should it be regarded as investment research. It has not been prepared in accordance with legal requirements designed to promote the independence of investment research and is not subject to any prohibition on dealing ahead of its dissemination. This document is not contractually binding nor are we required to provide this to you by any legislative provision.
All data from HSBC Asset Management unless otherwise specified. Any third-party information has been obtained from sources we believe to be reliable, but which we have not independently verified.
HSBC Asset Management is the brand name for the asset management business of HSBC Group, which includes the investment activities that may be provided through our local regulated entities. HSBC Asset Management is a group of companies in many countries and territories throughout the world that are engaged in investment advisory and fund management activities, which are ultimately owned by HSBC Holdings Plc. (HSBC Group).
- In Australia, this document is issued by HSBC Bank Australia Limited ABN 48 006 434 162, AFSL 232595, for HSBC Global Asset Management (Hong Kong) Limited ARBN 132 834 149 and HSBC Global Asset Management (UK) Limited ARBN 633 929 718. This document is for institutional investors only and is not available for distribution to retail clients (as defined under the Corporations Act). HSBC Global Asset Management (Hong Kong) Limited and HSBC Global Asset Management (UK) Limited are exempt from the requirement to hold an Australian financial services license under the Corporations Act in respect of the financial services they provide. HSBC Global Asset Management (Hong Kong) Limited is regulated by the Securities and Futures Commission of Hong Kong under the Hong Kong laws, which differ from Australian laws. HSBC Global Asset Management (UK) Limited is regulated by the Financial Conduct Authority of the United Kingdom and, for the avoidance of doubt, includes the Financial Services Authority of the United Kingdom as it was previously known before 1 April 2013, under the laws of the United Kingdom, which differ from Australian laws;
- In Bermuda, this document is issued by HSBC Global Asset Management (Bermuda) Limited, of 37 Front Street, Hamilton, Bermuda which is licensed to conduct investment business by the Bermuda Monetary Authority;
- In France, Belgium, Netherlands, Luxembourg, Portugal, Greece, Finland, Norway, Denmark and Sweden this document is issued by HSBC Global Asset Management (France), a Portfolio Management Company authorised by the French regulatory authority AMF (no. GP99026);
- In Germany, this document is issued by HSBC Global Asset Management (Deutschland) GmbH which is regulated by BaFin (German clients) respective by the Austrian Financial Market Supervision FMA (Austrian clients);
- In Hong Kong, this document is issued by HSBC Global Asset Management (Hong Kong) Limited, which is regulated by the Securities and Futures Commission. This content has not been reviewed by the Securities and Futures Commission;
- In India, this document is issued by HSBC Asset Management (India) Pvt Ltd. which is regulated by the Securities and Exchange Board of India;
- In Italy and Spain, this document is issued by HSBC Global Asset Management (France), a Portfolio Management Company authorised by the French regulatory authority AMF (no. GP99026) and through the Italian and Spanish branches of HSBC Global Asset Management (France), regulated respectively by Banca d’Italia and Commissione Nazionale per le Società e la Borsa (Consob) in Italy, and the Comisión Nacional del Mercado de Valores (CNMV) in Spain;
- In Japan, this document is issued by HSBC Asset Management (Japan) Ltd (JRN 3010001124868), regulated by the Financial Services Agengy;
- In Malta, this document is issued by HSBC Global Asset Management (Malta) Limited which is regulated and licensed to conduct Investment Services by the Malta Financial Services Authority under the Investment Services Act;
- In Mexico, this document is issued by HSBC Global Asset Management (Mexico), SA de CV, Sociedad Operadora de Fondos de Inversión, Grupo Financiero HSBC which is regulated by Comisión Nacional Bancaria y de Valores;
- In the United Arab Emirates, this document is issued by HSBC Investment Funds (Luxembourg) S.A. – Dubai Branch (Level 20, HSBC Tower, PO Box 66, Downtown Dubai, United Arab Emirates) regulated by the Capital Market Authority (CMA) in the UAE to conduct investment fund management, portfolios management, fund administration activities (CMA Category 2 license No.20200000336) and promotion activities (CMA Category 5 license No.20200000327).
- In the United Arab Emirates, this document is issued by HSBC Global Asset Management MENA, a unit within HSBC Bank Middle East Limited, U.A.E Branch, PO Box 66 Dubai, UAE, regulated by the Central Bank of the U.A.E. and the Capital Market Authority in the UAE under CMA license number 602004 for the purpose of this promotion and lead regulated by the Dubai Financial Services Authority. HSBC Bank Middle East Limited is a member of the HSBC Group and HSBC Global Asset Management MENA are marketing the relevant product only in a sub-distributing capacity on a principal-to-principal basis. HSBC Global Asset Management MENA may not be licensed under the laws of the recipient’s country of residence and therefore may not be subject to supervision of the local regulator in the recipient’s country of residence. One of more of the products and services of the manufacturer may not have been approved by or registered with the local regulator and the assets may be booked outside of the recipient’s country of residence.
- In Singapore, this document is issued by HSBC Global Asset Management (Singapore) Limited, which is regulated by the Monetary Authority of Singapore. The content in the document/video has not been reviewed by the Monetary Authority of Singapore;
- In Switzerland, this document is issued by HSBC Global Asset Management (Switzerland) AG. This document is intended for professional investor use only. For opting in and opting out according to FinSA, please refer to our website; if you wish to change your client categorization, please inform us. HSBC Global Asset Management (Switzerland) AG having its registered office at Gartenstrasse 26, PO Box, CH-8002 Zurich has a licence as an asset manager of collective investment schemes and as a representative of foreign collective investment schemes. Disputes regarding legal claims between the Client and HSBC Global Asset Management (Switzerland) AG can be settled by an ombudsman in mediation proceedings. HSBC Global Asset Management (Switzerland) AG is affiliated to the ombudsman FINOS having its registered address at Talstrasse 20, 8001 Zurich. There are general risks associated with financial instruments, please refer to the Swiss Banking Association (“SBA”) Brochure “Risks Involved in Trading in Financial Instruments”;
- In Taiwan, this document is issued by HSBC Global Asset Management (Taiwan) Limited which is regulated by the Financial Supervisory Commission R.O.C. (Taiwan);
- In Turkiye, this document is issued by HSBC Asset Management A.S. Turkiye (AMTU) which is regulated by Capital Markets Board of Turkiye. Any information here is not intended to distribute in any jurisdiction where AMTU does not have a right to. Any views here should not be perceived as investment advice, product/service offer and/or promise of income. Information given here might not be suitable for all investors and investors should be giving their own independent decisions. The investment information, comments and advice given herein are not part of investment advice activity. Investment advice services are provided by authorized institutions to persons and entities privately by considering their risk and return preferences, whereas the comments and advice included herein are of a general nature. Therefore, they may not fit your financial situation and risk and return preferences. For this reason, making an investment decision only by relying on the information given herein may not give rise to results that fit your expectations.
- In the UK, this document is issued by HSBC Global Asset Management (UK) Limited, which is authorised and regulated by the Financial Conduct Authority;
- In the US, this document is issued by HSBC Securities (USA) Inc., an HSBC broker dealer registered in the US with the Securities and Exchange Commission under the Securities Exchange Act of 1934. HSBC Securities (USA) Inc. is also a member of NYSE/FINRA/SIPC. HSBC Securities (USA) Inc. is not authorized by or registered with any other non-US regulatory authority. The contents of this document are confidential and may not be reproduced or further distributed to any person or entity, whether in whole or in part, for any purpose without prior written permission.
- In Chile, operations by HSBC's headquarters or other offices of this bank located abroad are not subject to Chilean inspections or regulations and are not covered by warranty of the Chilean state. Obtain information about the state guarantee to deposits at your bank or on www.cmfchile.cl;
- In Colombia, HSBC Bank USA NA has an authorized representative by the Superintendencia Financiera de Colombia (SFC) whereby its activities conform to the General Legal Financial System. SFC has not reviewed the information provided to the investor. This document is for the exclusive use of institutional investors in Colombia and is not for public distribution;
- In Costa Rica, the Fund and any other products or services referenced in this document are not registered with the Superintendencia General de Valores (“SUGEVAL”) and no regulator or government authority has reviewed this document, or the merits of the products and services referenced herein. This document is directed at and intended for institutional investors only.
- In Peru, HSBC Bank USA NA has an authorized representative by the Superintendencia de Banca y Seguros in Perú whereby its activities conform to the General Legal Financial System - Law No. 26702. Funds have not been registered before the Superintendencia del Mercado de Valores (SMV) and are being placed by means of a private offer. SMV has not reviewed the information provided to the investor. This document is for the exclusive use of institutional investors in Perú and is not for public distribution;
- In Uruguay, operations by HSBC's headquarters or other offices of this bank located abroad are not subject to Uruguayan inspections or regulations and are not covered by warranty of the Uruguayan state. Further information may be obtained about the state guarantee to deposits at your bank or on www.bcu.gub.uy.
Copyright © HSBC Global Asset Management Limited 2026. All rights reserved. No part of this publication may be reproduced, stored in a retrieval system, or transmitted, on any form or by any means, electronic, mechanical, photocopying, recording, or otherwise, without the prior written permission of HSBC Asset Management.
Content ID: D069843_v2.0; Expiry date: 31.03.2027.